Jordan is standing in his driveway in Vancouver, looking at the settlement email on his phone and wondering how a 2021 midsize SUV can suddenly be worth so little. The insurer's number looks neat, clean, and wrong. That feeling is common, because the fight in a total loss claim usually isn't about the damage, it's about vehicle depreciation rates and the way a carrier chooses to apply them.
In Oregon and Washington, that number can decide whether you walk away whole or spend weeks arguing over a lowball offer. Insurers lean on valuation software that smooths over the ugly parts, the steep early drop, the model-specific swings, the condition details, and the local market quirks that move cash value. If you know how depreciation really works, you stop treating the offer like a verdict and start treating it like a draft.
This matters even more in the Pacific Northwest, where appraisal disputes often turn on timing, trim, mileage, and whether the carrier used a generic curve instead of a real comparable set. If the math is off, the settlement is off. A fair-market answer starts with the vehicle's value trend, not the insurer's first number, and fair market vehicle valuation guidance is where a lot of owners first realize how that gap gets built.
When the Insurer's Number Feels Too Low
Jordan didn't need a lecture on depreciation. He needed to know why his totaled SUV, which still had low miles and a clean service history, got priced like a tired commuter car. The answer was sitting inside the carrier's model, a generic curve that ignores what separates one 2021 midsize SUV from another.
The part owners miss
Depreciation is the hidden lever in a total loss offer. Once the insurer decides what your vehicle was worth right before the loss, every shortcut in that valuation pushes the final check down. If the software treats your vehicle like an average example instead of your actual one, the gap lands in your pocket.
That's why this issue is so frustrating in Oregon and Washington claims. The fight usually isn't over whether the car was totaled, it's over how the insurer got to the number. If the starting point is weak, the rest of the settlement follows that weakness.
A lot of owners assume the problem is damage severity. It usually isn't. It's the valuation method, the comparable set, and the depreciation curve the carrier used to justify the payout.
Practical rule: if the offer feels too low, don't argue feelings, argue the inputs. Ask what comparables were used, how trim and options were adjusted, and whether the valuation reflects your actual market.
Jordan's case is the same case thousands of drivers face after a crash in Portland, Vancouver, Salem, Tacoma, or Spokane. The details differ, but the playbook doesn't. First understand the curve, then test the number, then decide whether the insurer's math deserves a fight.
Understanding Vehicle Depreciation Rates
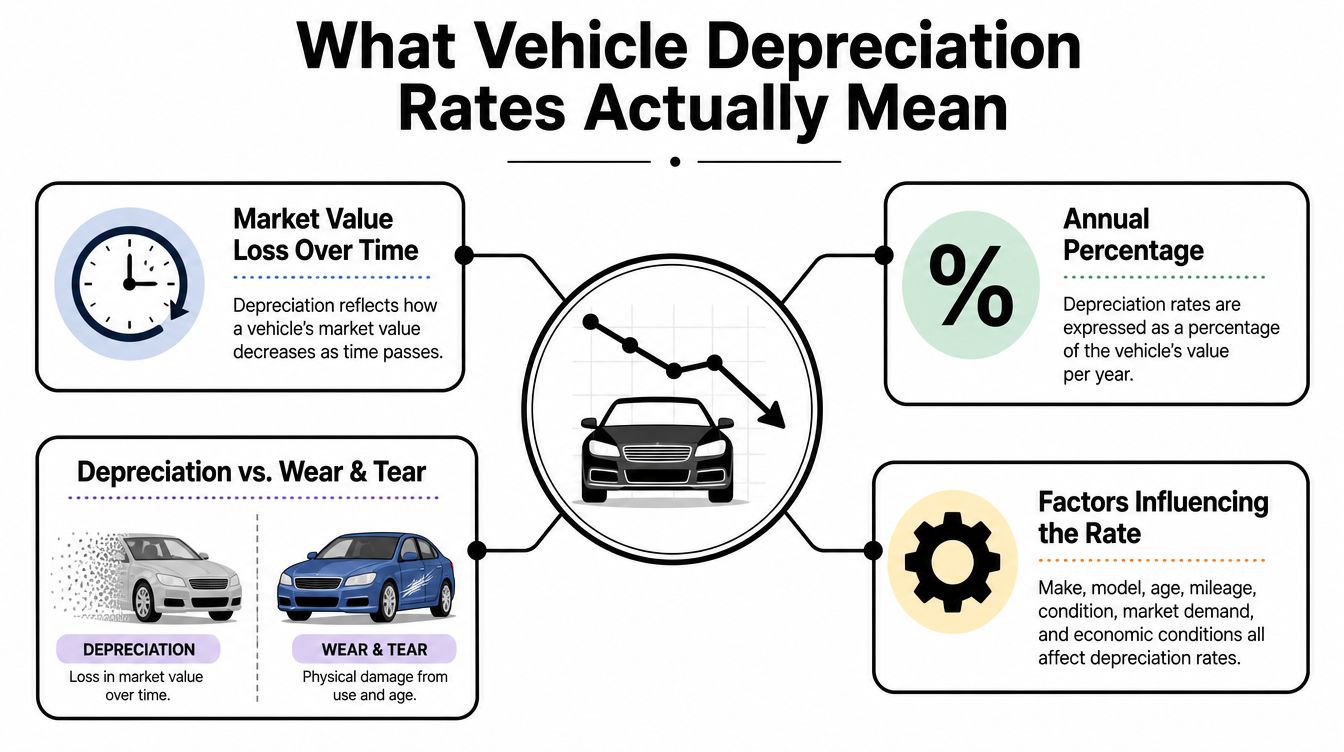
Vehicle depreciation rates tell you how fast a car loses market value over time. That is not the same thing as wear and tear. Wear and tear is the physical use a vehicle takes, while depreciation reflects the market's price reaction to age, miles, condition, and demand.
The curve is steep early
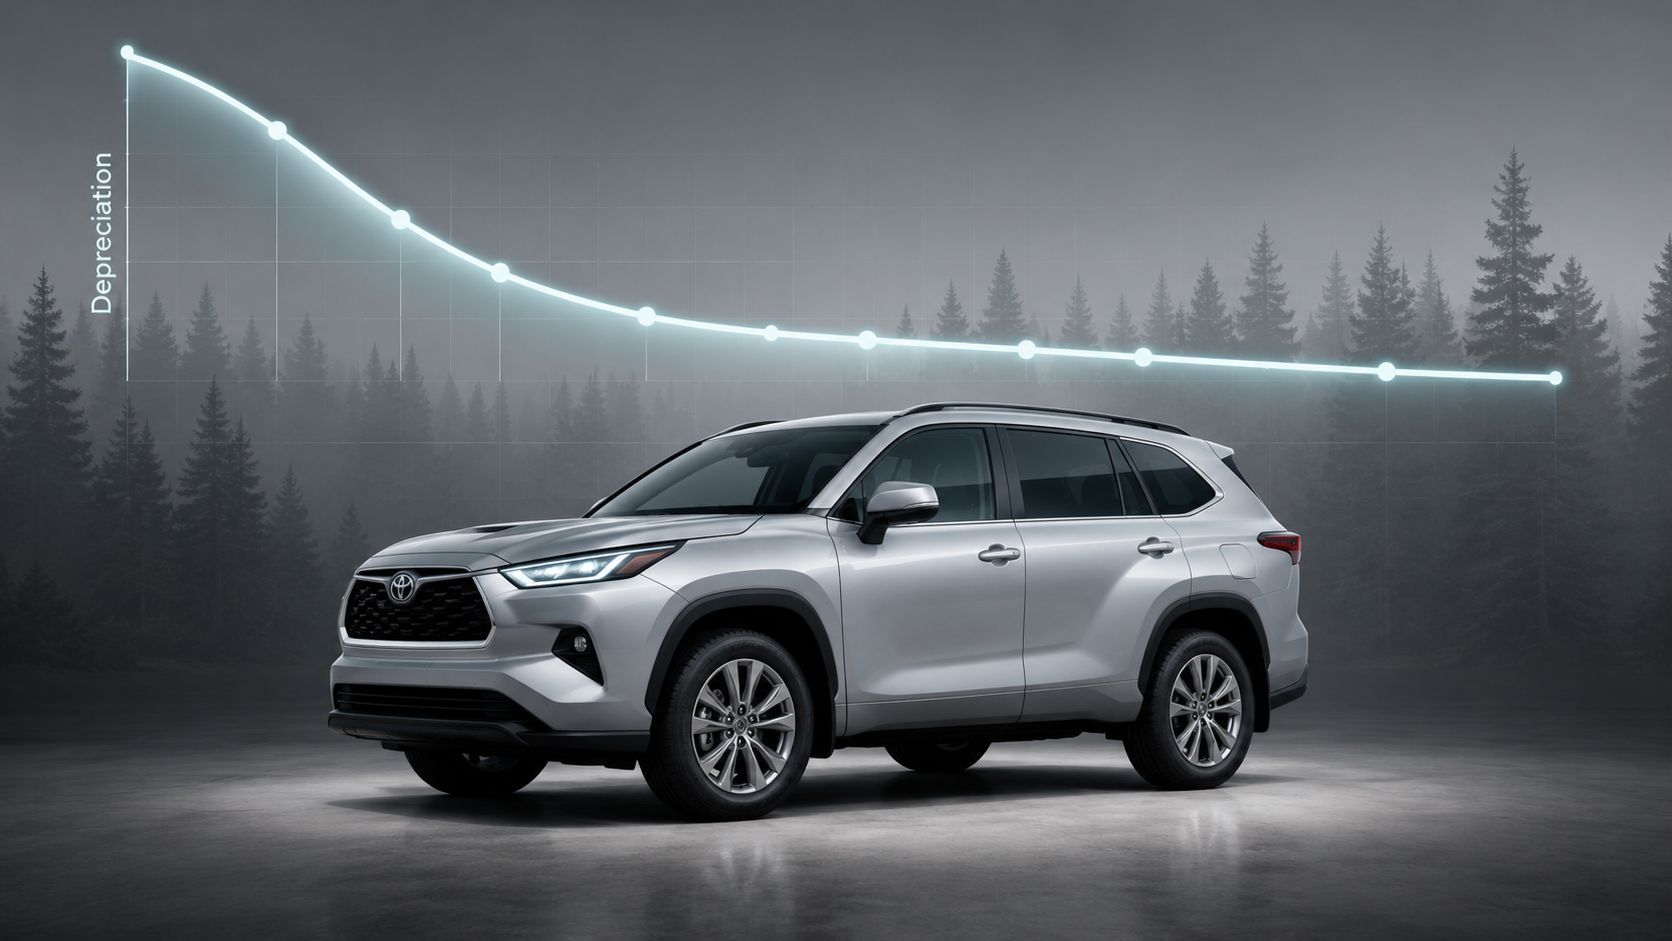
Carfax says new cars typically lose more than 10% in the first month, about 20% in the first year, and roughly 60% by five years from original purchase price, which shows how front-loaded the loss really is in the early years (Carfax depreciation guide). Kelley Blue Book says new cars depreciate about 30% over the first two years and then usually lose 8% to 12% per year after that, which is another way of saying the curve flattens as the vehicle ages.
That shape matters in claims. A carrier that treats depreciation like a straight line from year one is already distorting value. The first years hurt the most, and any formula that hides that truth can make a total loss payment look more generous than it really is. Insurance valuation software often smooths over the sharp early drop because it is built for speed, not fairness. If your settlement depends on that shortcut, you should know how pricing intelligence works, because the model behind the number matters as much as the number itself (how pricing intelligence works).
Why averages are only a starting point
The common mistake is treating one average depreciation number as the whole story. It is not. Averages help you spot a bad offer, but they do not settle the claim.
The right way to read the curve is direct. Some vehicles lose value hard early, then slow down. Others hold up better because the segment stays strong, the equipment is better, or condition separates them from the pack. If your car sits in a weak segment, the opposite happens.
A settlement offer should follow that market behavior, not flatten it into a neat spreadsheet line. If the insurer's valuation does not match the market, the number is just convenient.
The Drivers That Move Your Number Up or Down
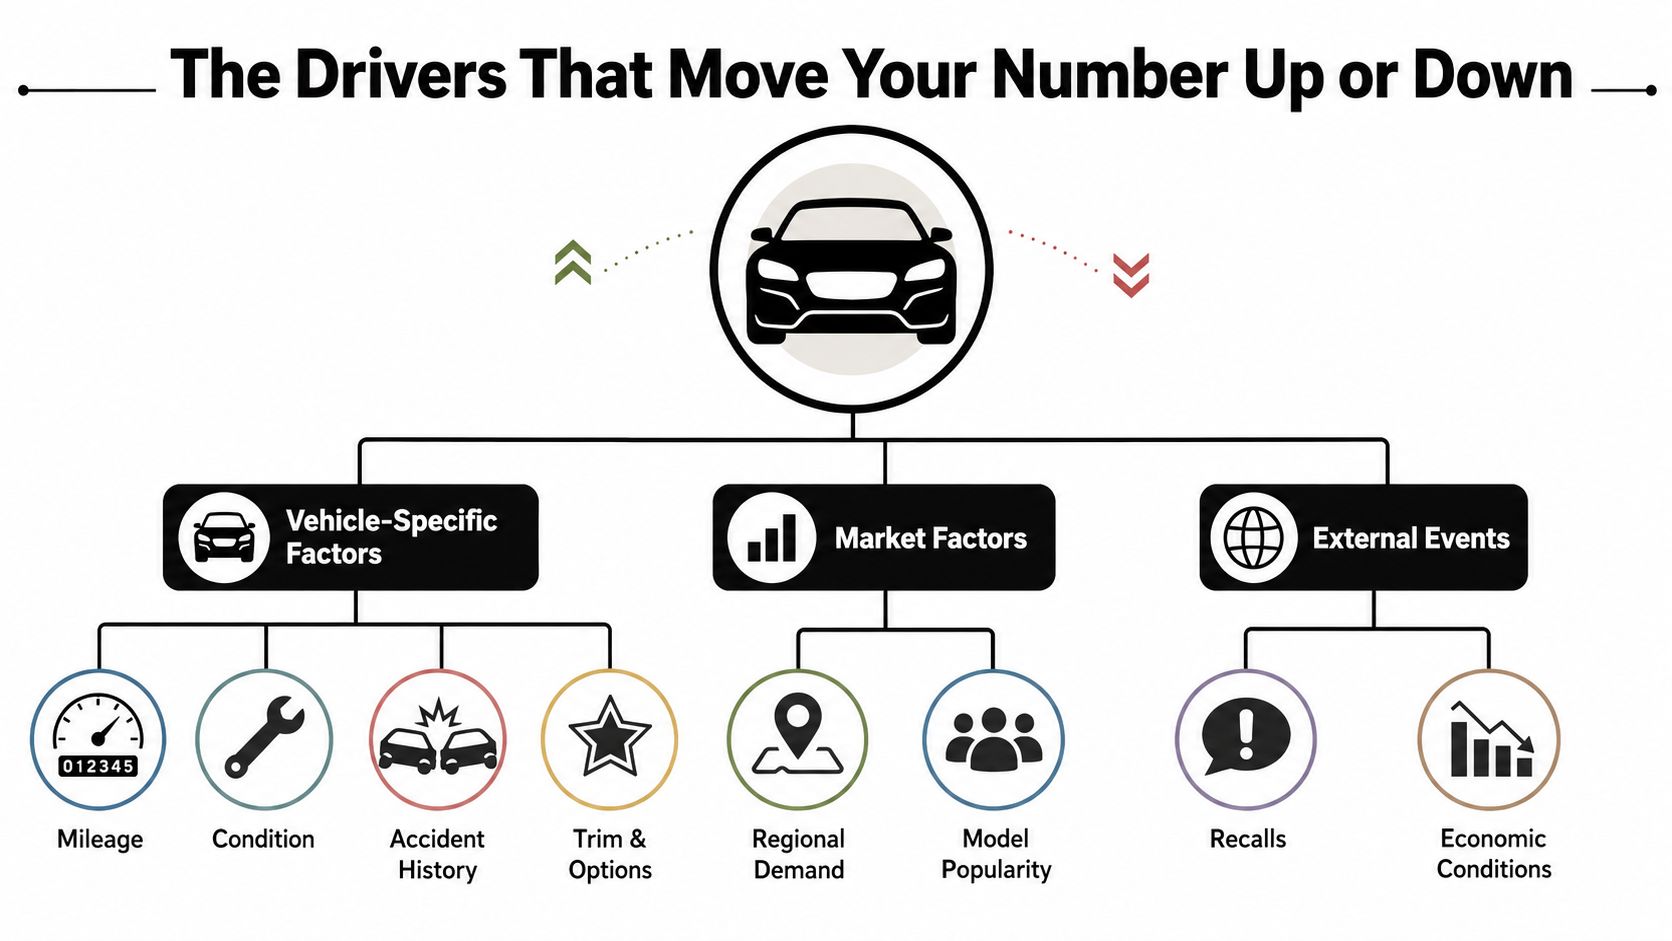
Mileage gets attention, but it isn't the only lever. In a Pacific Northwest claim, the biggest swing usually comes from a mix of condition, trim and options, and segment demand, with mileage and age sitting right behind them. A clean vehicle with better equipment can sit on a very different market track than a stripped example of the same year.
What matters most in a claim
Condition is the first thing a fair valuation should respect. Clean interior, intact paint, documented maintenance, and no prior damage all matter because buyers pay more for certainty.
Trim and options can move the number fast. Heated seats, advanced safety packages, premium audio, and factory upgrades are not decorative when comparable sales include them. A valuation that misses those features is not measuring your vehicle, it's measuring a base model fantasy.
Mileage and age still anchor the curve. The U.S. Bureau of Labor Statistics shows annual depreciation rates of 12.1% for new automobiles and 10.3% for used automobiles, which reinforces the basic truth that older vehicles still lose value, just more slowly than brand-new ones (BLS automobile consumption article). That's why a low-mileage vehicle can outperform a generic age-based estimate, especially when the condition record is strong.
What you can document, and what you can't
Some inputs are in your control. Some aren't. You can document condition, service history, and options. You can also challenge weak comparable sales and missing equipment. You can't force regional demand or model popularity to cooperate.
That's why how pricing intelligence works matters here. Valuation is basically a pricing problem, and pricing systems only work when the inputs reflect the actual market. If the software uses sloppy comparables or ignores the right trim, the output is just polished error.
Practical rule: keep the evidence that a buyer would care about, not just the repair file. Photos, window sticker details, maintenance records, and local comparable listings are the pieces that change the valuation fight.
Two identical model years can land miles apart on the depreciation curve. That's not theory, that's claim work.
Why Your Segment Changes the Whole Conversation
Your vehicle's segment drives the claim more than the average does. A worn-out commuter hatchback, a luxury sedan, and an EV do not sit on the same depreciation curve, and insurers know it. Black Book's 2025 report showed the overall market fell 12.5% for the full year, while compact cars were around -5.8% and full-size cars around -6.3% in the annual view (Black Book 2025 Vehicle Depreciation Report). Generic depreciation advice misleads owners because it hides the significant variation between segments.
Segment comparison on five-year vehicle depreciation rates
| Segment | Typical Five-Year Loss | Why It Depreciates This Way |
|---|---|---|
| City cars | Retain 41% of original list price at 60 months in one tracker | Lower upfront cost, simpler market expectations, and narrower pricing bands |
| Average mainstream vehicle | Around 55% to 60% loss depending on market and segment | Broad demand, but the curve still drops early and then levels out |
| EVs | Often faster than mainstream gas vehicles, with one synthesis citing about 58.8% five-year loss | Rapid technology change and manufacturer price cuts reshape resale expectations |
| Luxury vehicles | Often worse than mainstream segments | Higher original prices, more expensive options, and sharper discounting in used markets |
| Larger cars and weaker segments | Highly variable | Demand shifts can hit them harder than smaller, more practical vehicles |
The Global Auto Index depreciation tracker supports the city-car and mainstream-vehicle comparisons above (Global Auto Index depreciation tracker).
If you own a vehicle in a weak segment, the carrier's formula can still miss the mark. It may pull comparables from the wrong trim, the wrong equipment level, or the wrong sales channel, then dress that up as objective valuation.
EVs need special attention. They usually lose value faster than mainstream gas vehicles because technology changes quickly and manufacturers keep resetting price expectations. Luxury vehicles have their own problem, since a high original MSRP can leave a big gap between sticker price and what buyers will pay on the used market.
Claim takeaway: when your segment is volatile, the insurer's average is almost always the wrong benchmark.
If you own a specific model, segment data is not a side note. It is the argument.
Two Formulas You Can Use to Estimate Your Own Number
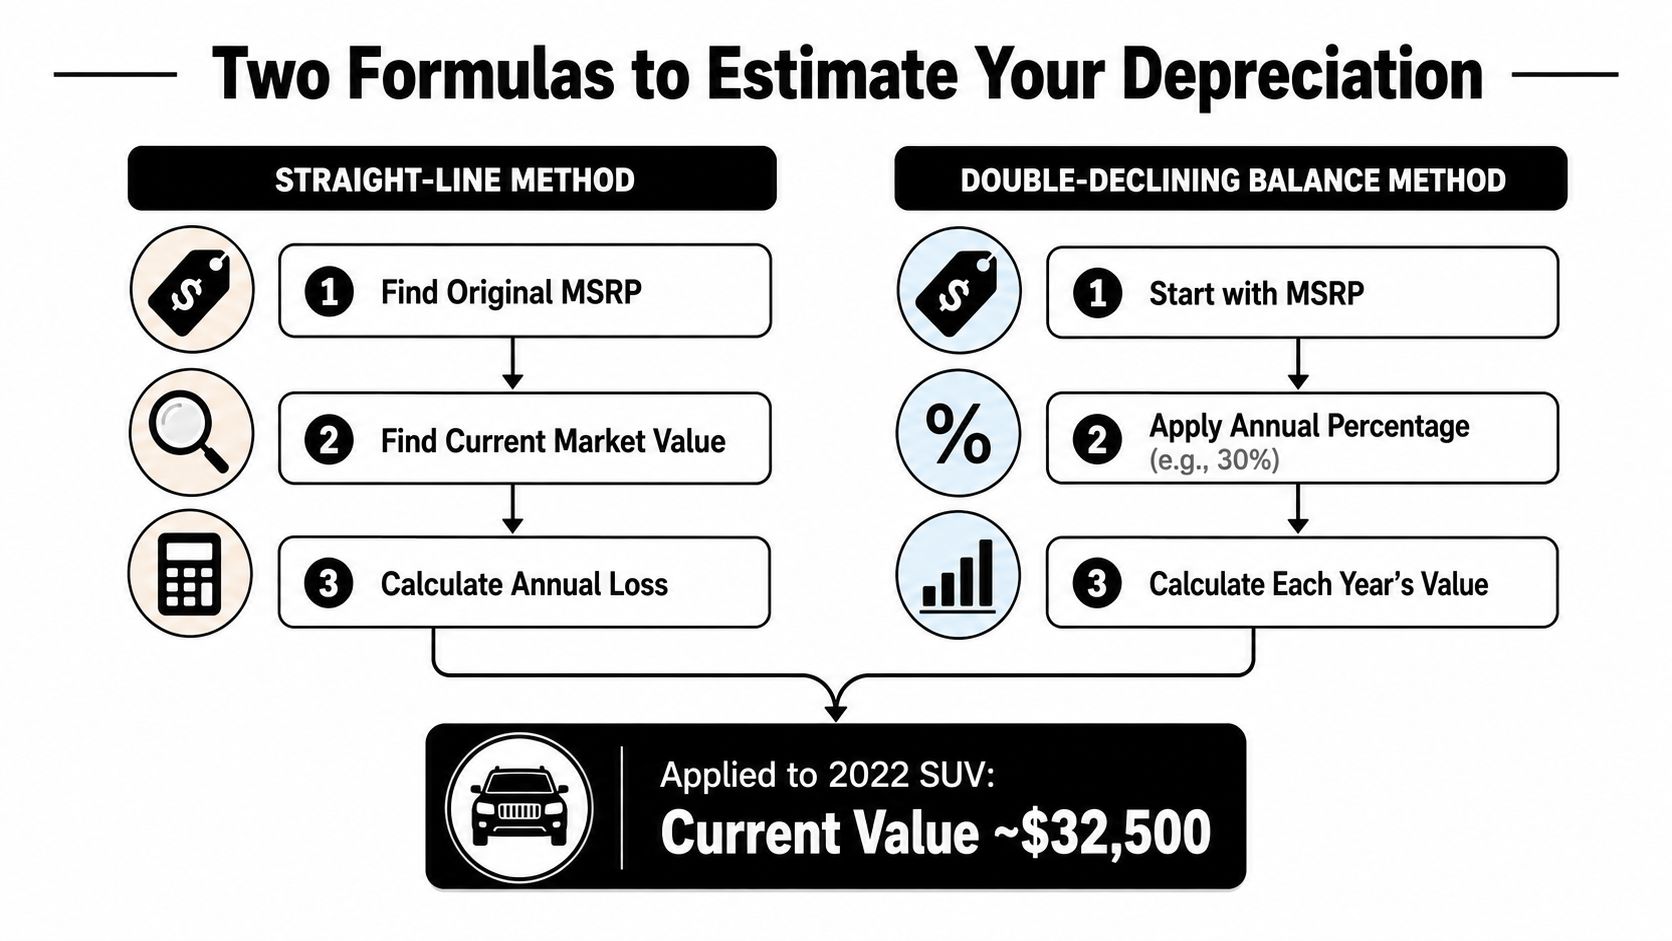
An insurer can run software all day. You can still estimate the number like an appraiser and spot where the carrier is soft-pedaling the loss. The two basic approaches are straight-line depreciation and a front-loaded curve that matches how vehicles lose value.
Straight-line method
Start with the original MSRP, subtract the estimated current market value, and spread that loss evenly across the ownership period. It is simple, and it is blunt.
A 2022 SUV with a $32,000 MSRP can look neat on paper under a straight-line estimate. Cars do not lose value in neat increments. This method smooths out the early drop and can hide the part of the loss that matters most in a claim.
Front-loaded curve method
Use the early-loss pattern instead. The Carfax depreciation guide says a new car can lose more than 10% in the first month and about 20% in the first year, while Kelley Blue Book says new cars lose about 30% over the first two years before the decline slows down. That is the shape you should expect if you want a number that resembles the market.
For the same 2022 SUV, the front-loaded method usually produces a lower current value than the straight-line method if the vehicle is still in the early part of its lifecycle. That difference is not academic in a settlement. If the carrier chooses the softer method, the difference comes out of your settlement.
What to do with the estimate
Use the formula as a check, not a confession. If the insurer's number ignores the front-loaded reality of depreciation, ask for the comparison set and the adjustment logic. Then compare that to the actual market. If the math still does not hold up, use the appraisal clause guidance for car depreciation claims to press for an independent review.
The guide to property insurance cash value explains why carriers focus so heavily on pre-loss value and why depreciation shows up in the valuation process.
Direct advice: if two methods produce very different numbers on the same vehicle, the carrier's choice of method is part of the negotiation.
Diminished Value, Total Loss, and the Appraisal Clause
A repaired car can still be worth less because it has an accident history. That's diminished value, and it's a different claim problem from total loss. In a total loss, the fight is over the actual cash value of the vehicle right before the loss, and depreciation sits at the center of that dispute.
For a plain-English look at how insurers frame value, the guide to property insurance cash value is useful background. It helps explain why insurers focus so heavily on pre-loss value and why they use depreciation as part of the valuation process.
Why the appraisal clause matters
Most Oregon and Washington policies include an appraisal clause. When the owner and the carrier can't agree on value, either side can demand an independent appraisal. That matters because it moves the discussion out of the insurer's software and into a real market review.
The iSeeCars 2026 analysis of more than 950,000 five-year-old used cars found an average 41.8% depreciation over five years, with the best-retaining model losing 9.6% and the worst losing 63.1% (iSeeCars 2026 analysis referenced in Carfax data summary). That spread is the whole case for appraisal. A generic percentage is useless when model-specific performance varies that much.
Whether whether insurance pays for car depreciation after an accident becomes a practical question, not a theoretical one. If the carrier's valuation is weak, a certified independent appraisal can replace a biased number with one that tracks the actual market.
Practical rule: if the settlement amount depends on a vague average, you're not looking at a valuation, you're looking at a shortcut.
The clearest tactic in a lowball total loss dispute is often the appraisal clause. It doesn't guarantee a better answer, but it forces a better process.
What Oregon and Washington Owners Should Do
Start with proof, not anger. Take photos of the vehicle, the odometer, the interior, the tires, and any options that matter. Save service records, recent upgrades, and anything that shows your car was better than the carrier's generic example.
The first moves
Get the carrier's valuation report. Read the comps, trim adjustments, mileage adjustments, and condition notes. If the report does not reflect your actual vehicle, challenge the missing facts, not just the final number.
Pull local comparables. Use dealer listings and private-party listings in Oregon and Washington, since regional channel matters. The point is to show what similar vehicles are selling for in the market you live in, not in an abstract national average.
Keep the vehicle available for inspection. If the carrier wants another look or your appraiser needs one, make that easy. Delays work in the insurer's favor.
When to escalate
If the number is materially low, invoke the appraisal clause and get a certified independent appraiser involved. In the Pacific Northwest, that step often changes the tone of the negotiation because it forces a real market analysis instead of a one-sided software output. If you need help with that part of the claim, diminished value support is where the process gets documented, challenged, and pushed back into the actual market.
Total Loss Northwest is one option for owners who want that process handled by a certified independent appraiser in Oregon and Washington. The work is simple in concept, value the car from the market, document the support, and push back when the carrier's math misses.
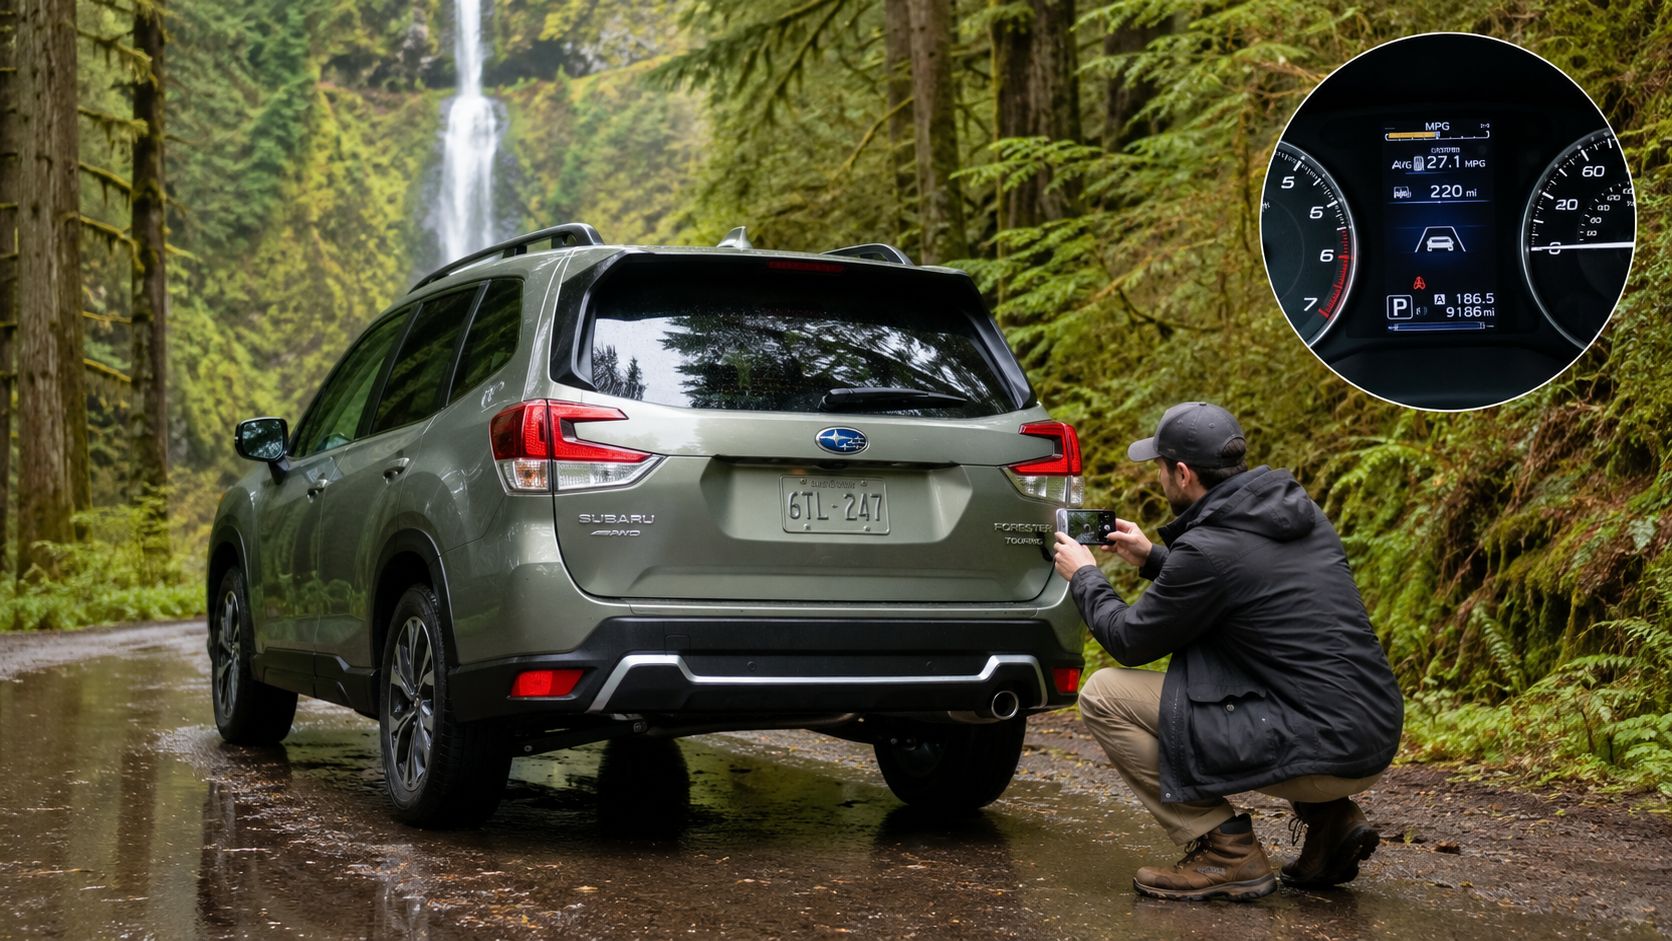
Action rule: document first, dispute second, appraise when the gap stays open.
The strongest claims are built in the first 72 hours after the loss. Once the paper trail is weak, the carrier gets to define reality for you.
Myths That Cost Owners Real Money
The insurer's first offer is an opening position. In a total loss claim, it only feels final when the owner accepts it without checking the valuation report line by line. That is how lowball settlements survive.
The idea that depreciation falls in a flat yearly percentage is another trap. It does not. Early loss is front-loaded, and the market follows a steeper curve than most owners expect. The common mistake is treating vehicle value like a straight line when the market moves in chunks, especially in the first years after purchase.
Clean history does not guarantee full value
A clean Carfax report helps, but it does not lock in market value. Segment, mileage, trim, local demand, and timing still move the number. A spotless record on the wrong vehicle in the wrong market can still produce a weak payout, and that is exactly how carriers get away with underrating cars that should have brought more.
Accident history is not the main factor depreciation cares about in a total loss file. The market usually cares more about what similar vehicles are selling for, how well yours was equipped, and how it stacks up against the right segment. That is why a generic software estimate can miss the mark even when the damage is obvious.
Bottom line: do not negotiate against a myth. Negotiate against the actual comparables and the actual valuation logic.
Jordan's offer looked clean because the math was clean, not because it was right. Once you understand how vehicle depreciation rates really work, the insurer's first number stops sounding like fact and starts sounding like a challenge.
If your total loss or diminished value offer in Oregon or Washington does not match the market, get help before you sign. Visit Total Loss Northwest to work with certified independent appraisers who handle valuation disputes, appraisal-clause claims, and lowball settlements with the documentation insurers have to take seriously.